Contributing Editor Robert Adler writes:
This is the fourth, and final, of my columns on the Topology, Probability, and Statistics triad. You might recall that the common thread was TDA, or Topological Data Analysis. I started by advertising TDA in a casual commercial for the IMS community, continued with some tendentious tutoring for topological tenderfeet, and proceeded to a pedagogical podium to preach to probabilists. Continuing to advance alliteratively, I want to conclude these columns with a seriously sinister statistical sermon on the theme of Let’s not make the same mistake twice!
Of course, before sermonizing, it is traditional to recall vaguely relevant verses from a prophetic source to be bent to the preacher’s needs. My source is a truly excellent article by John Tukey, published in the 1962 Annals of Mathematical Statistics. The rambling 61 page paper, entitled “The Future of Data Analysis”, has the following lines, among many others expressing similar sentiments:
• “Statistics has contributed much to data analysis.”
• “By and large, the great innovations in statistics have not had correspondingly great effects on data analysis.”
• “We should seek out new questions to be answered.”
• “We should seek out unfamiliar summaries of observational material, and establish their useful properties.”
The first two points are seemingly contradictory, but are explained in the article along the lines of “when we are motivated by something outside of what we know, we can do great stuff, but when we self-motivate, looking mainly in a neighborhood of the familiar, then we end up with ‘great innovations’ which impress nobody but ourselves.”
The second two points suggest the road to relevance, but…
Despite Tukey’s timely warning, around about the same time parts of Statistics seemingly took a wrong turn, and instead of rolling along the road to relevance, pursued a path to purgatory.
Consider what was happening at the time of Tukey’s article. Just four years earlier, Frank Rosenblatt had created the perceptron, an algorithm for pattern recognition based on a two-layer neural network using no more than simple addition and subtraction. Seven years later Minsky and Papert almost killed the fledging area of machine learning with some negative results about the ability of algorithms to actually achieve what it was hoped they could do. However, by the 1990s the not unrelated tool of Vapnik’s support vector machines was making an enormous impact, and today, in the 2010s, neural nets are back with a vengeance following the general availability of powerful processors and the advent of deep learning.
It is of more than mere historical interest that, early in its development, Computer Science, as a discipline and as university departments, adopted machine learning as one of its own academic offspring. In doing so, the discipline found one of the highways to highbrow Heaven, gaining scientific and engineering recognition, while the departments reaped the reward of attracting excellent students.
On the other hand, back then, Statistics and statisticians reacted quite differently to the appearance of machine learning in all its forms. I am old enough to remember some of some of my colleagues’ claims:
• Nothing new there. It’s just another form of regression.
• Estimating more parameters than there are data points? Ridiculous!
• No physical meaning to parameters, even when you know them. Who knows what the black box means?
• Totally inappropriate for hypothesis testing. Student would turn in his grave.
And these are just the complaints that I remember.
Of course, times have changed, and many statistics departments are now hiring machine learners (or teachers) and some of the best researchers out there in the machine learning world are semi-statisticians, often with joint appointments. But none of this changes the fact that thirty years ago we made a mistake for the first time, when a new set of questions, with new summaries of observational material (cf. Tukey), were at best ignored, at worst ridiculed, and Statistics lost a subject that might well have become its own. In doing so Statistics lost some important momentum, and, perhaps most importantly, it lost a generation of bright young graduate students who were attracted to the Computer Science world. To some extent Statistics departments are still suffering from this mistake today. I believe that the entire area of machine learning would have developed differently, been richer, and certainly with a stronger mathematical foundation, had statisticians developed an interest in it in its early days.
(In fairness, it should be noted that probabilists did a somewhat better job than statisticians in terms of jumping on the machine learning bandwagon. I doubt that this was because they were intrinsically wiser, but was probably due to the fact that it gave them an entire new class of models to which their tools were well suited. And there is nothing a probabilist likes better than a new model.)
So, now here we are in 2015, and there is another big challenge before us—and by ‘us’ I mean all IMS-ers, probabilists and statisticians alike. A new tool, TDA, has arisen, this time emerging from one of the most esoteric and abstract areas of Pure Mathematics — Algebraic Topology — and it is providing, in Tukey’s words above, most distinctly “unfamiliar summaries of observational material”.
As I have argued in previous columns, TDA is having a significant and growing impact in the world of data analysis. Its most recent “killer app” is to be found in a paper studying the effect of the psychedelic drug psilocybin (“magic mushroom” to the streetwise) on networks in the brain. Using purely topological methods, an Anglo-Italian, multidisciplinary group, led by Francesco Vaccarino, and made up of mathematicians, physicists, a psychiatrist-cum-neuropsychopharmacologist, and a psychologist, produced the picture below.
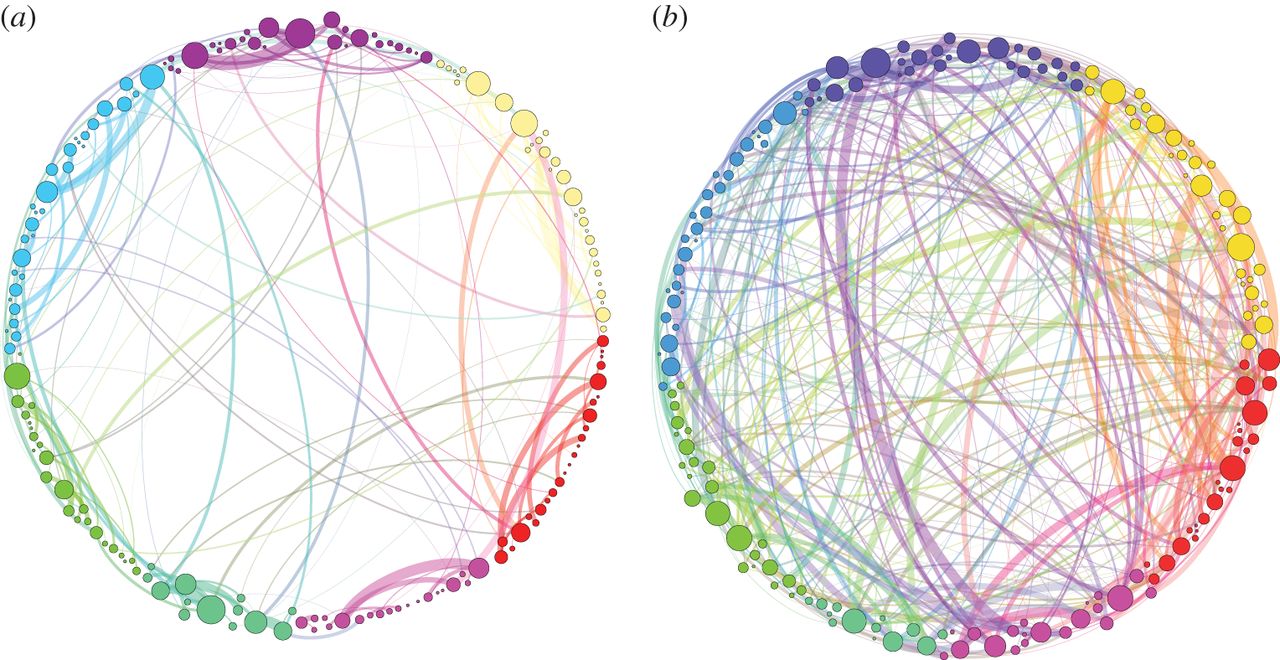
The dots around the circle represent 194 sites in the brain, and the lines joining them represent significant connections between these sites. The lines in the left hand diagram (a) represent these connectivities in normal brains, while the one on the right, (b), shows the situation after an injection of psilocybin, yielding a state of hyper-connectivity. The difference is striking, and explains the ability of the psychedelic brain to “smell the color yellow” and “taste the sound of a bell” (before it burns out forever).
The reason I called this a “killer app” is that it is putting TDA on the public map in a way it was never there before. While recent workshops in TDA have been extremely popular among (mainly) young mathematicians, this is a story that has reached the popular press, the evening news, etc. The paper, “Homological scaffolds of brain functional networks”, was published in the Journal of the Royal Society Interface, in late October 2014. At the time of writing, it had close to 40,000 downloads.
The tools of the paper are those of persistence homology for weighted networks. Statistics appears in the paper, in that there are a few Kolmogorov–Smirnov tests, always a great standby when you need something but don’t know anything. However, apart from this, and despite the fact that the study raises many statistical issues, there is not even the slightest attempt to think statistically.
Naught. Nothing. Nada. Zero. Zilch. Zippo.
Until recently this was more or less true of TDA as a whole. Over the last couple of years this has started to change, and statisticians are beginning to draw novel new ideas from TDA while, at the same time, exporting to the TDA community the importance of basic concepts in Statistics. These are things that IMS-ers take for granted: the fact that almost all data is sampled from a population, and sample variation is crucial to understanding the reliability of one’s data; almost all data is subject to error of some kind, another source of variability; models are just that—models, and not indisputable truth.
These are natural issues for us to raise, but they lead to problems that are not easy to solve. The tools of TDA, foremost among them persistent homology, are mathematical objects of a kind that neither probabilists nor statisticians have encountered in the past.
There are now teams of statisticians, involving people like Larry Wasserman at CMU, and Sayan Mukherjee at Duke, developing statistical tools appropriate for TDA. So far, most of the tools are from the post-Tukey period of Statistics, for, as Tukey hinted, the great theoretical innovations of our theories are not as easily or universally applicable as are data driven techniques such as resampling. Not being a statistician myself, I am not going to say more about what is being done here, in part since the probability of being caught out saying something stupid is just a little too high. However, going to the CMU and Duke websites will gently guide you into the slowly emerging literature of statistical TDA.
And so the sermon ends: IMS-ers beware. Look around you. There is something out there very close to us, and (whether TDA-ers admit it or not) needs us as much as we could benefit from it. We must grab the opportunity while we can, and let’s not make the same mistake twice.
Comments on “TOPOS 4: Let’s not make the same mistake twice”