We’ve all made measurements—height, weight, area, angle, volume, distance, time, speed, temperature—to name just a few basic types. There are more exotic types, one of my favourites being the HbA1c measurement of the three-month average glucose concentration in blood, a quantity important to people with diabetes. (How can one measure a three-month average?) Some of the best elementary mathematics involves measurement (e.g. lengths and angles). Historically, statistics has been greatly indebted to measurement (think accuracy, precision, and combination of measurements), while measurement is fundamental to physics, chemistry, and biology. And in psychology and the social sciences, measurement is harder, but no less important. In a way, measurement is the link between mathematics and science. Perhaps that’s why I like it so much.
As a boy, I loved taking measurements: lengths using a high quality ruler, widths using a gauge micrometer, and directions using a prismatic compass. Later, in our physics courses we “propagated errors,” and I liked the way we were always encouraged to evaluate our measurements to a greater precision than that on the visible scale. In my second course in statistics we carried out many simple experiments, measuring length, width (gauge micrometers again), time (using stopwatches), or the weight of grass we grew in the classroom (with or without fertilizer), all ways of getting data which we later analysed. (Thanks to the late Dr. Geoffrey Harcourt Jowett, and his inspirational “Practical Experimentation as a Teaching Method in Statistics.”)
Later, I encountered work from the US National Bureau of Standards (NBS), now the National Institute of Science and Technology. The old NBS produced some wonderful statisticians: Churchill Eisenhart, William J. Youden, John Mandel. Who cannot enjoy Eisenhart’s historical writings, including his 1971 ASA Presidential Address, “The Development of the Concept of the Best Mean of a Set of Measurements from Antiquity to the Present Day”? Equally engaging are Youden’s article, “Enduring Values,” and Mandel’s synthesis of his NBS experience in “The Statistical Analysis of Experimental Data.”
Lord Kelvin famously said, “When you can measure what you are speaking about and express it in numbers, you know something about it, but when you cannot measure it, when you cannot express it in numbers, your knowledge is of a meagre and unsatisfactory kind.” I agree. Almost all the data I encounter these days are measurements: on DNA, on RNA, on proteins, on metabolites. What never ceases to amaze me is the number and variety of methods biologists have for measuring the same quantity. The absolute or differential level of expression of a gene is fundamental to many studies in molecular biology. Forty years ago, this was done with electrophoresis-based Northern blots; thirty years ago by quantitative reverse transcription followed by the polymerase chain reaction; twenty years ago by microarrays, and serial analysis of gene expression using sequencing. About ten years ago, RNA-seq using second generation DNA-sequencing came on the scene, as did Nanostring. Another method in this series with a long history is digital drop PCR, which achieves a binary readout and then makes use of the Poisson distribution to connect the proportion of zeros (or non-zeros) to the mean. For measuring protein expression, there is a similar diversity of methods, as there is for measuring DNA methylation, and other biomolecules, and elsewhere in science.
We sometimes hear the term gold standard, typically from people who believe that there is a method, usually expensive, that gives true answers (± error). The problem is always that they can’t afford to use it! As a result, they use a baser method—a silver, bronze or even lead standard. I hear the term less often now, I think because people better appreciate that every measurement method has strengths and weaknesses around its dynamic range, material requirements, throughput, domain of applicability and ease of use.
A staple of measurement science is the inter-laboratory trial, where every one of a number of labs makes (usually replicate) measurements on the same set of materials, and the results are compared. An analogous situation arises when we replace labs by methods. How should we compare results across labs or methods, in the absence of The Truth? In the late 1960s, Mandel came up with the idea of using the laboratory averages for each of the materials as a surrogate for truth, and relating the individual labs to those averages by linear regression. His row-linear model gave easy visualization and insightful summary statistics, although it is not much used today. Recently, we used this model to compare three methods across 11 materials, with 280,000 measurements on each. It worked beautifully.
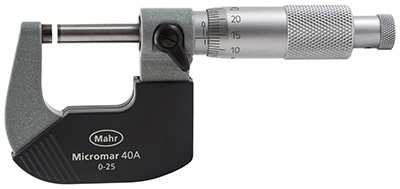
A gauge micrometer, like Terry’s childhood one
Comments on “Terence’s Stuff: Measurement”