Jon A. Wellner gave his IMS Presidential Address at the Joint Statistical Meetings in Baltimore. In it, Jon reviewed the influence of data science and machine learning on the teaching of statistics at the Graduate Level in the USA, and drew comparisons with several articles by Harold Hotelling from the 1940s.
1. Statistics and Data Science: Introduction
What has happened, and is happening? Many departments of statistics in the U.S. and elsewhere have initiated new MS degree programs in Data Science. Several departments (including Yale and the University of Texas at Austin) have changed their names to “Statistics and Data Science.” Many departments of statistics have created new pathways in Data Science and Machine Learning at the PhD level: for example, the University of Washington, Carnegie Mellon University, and Stanford, among others.
These changes naturally lead to questions concerning curricula and teaching in departments of statistics (and elsewhere) at all levels: undergraduate and graduate, including MS and PhD levels. Before proceeding, I should openly disclose that I have another reason for trying to address the issues in teaching raised by the changes briefly outlined above. Firstly, my department chair has asked me to review theory course offerings in the PhD program in Statistics at the UW, and recommend changes in the curriculum, if needed. Secondly, I will be teaching Statistics 581 and 582, Advanced Statistical Theory, during Fall and Winter quarters 2017–2018. So, what should I be teaching?
2. Exciting Times for Statistics and Data Science
The current excitement and attractions of statistics and data science have been propelled and provoked by:
a] increased demand for our knowledge and expertise;
b] the challenges of “big data” in terms of both computation and theory;
c] changes needed in statistical education to meet these demands and challenges.
2.1. Increasing demand. This is a “golden age” for statistics! Statisticians (and Data Scientists) are in great demand across a wide range of endeavors ranging from science to medicine and business or commercial enterprises, and with employment opportunities in academia, government, and industry.
The following table from the US Bureau of Labor Statistics puts “statistician” right at the top of job categories for which there will be increased demand for the period 2014–2024:
|
Projections, Bureau of Labor Statistics, 2014–24 |
|
|
Job Description |
Increase |
|
Statistician |
34% |
|
Mathematician |
21% |
|
Software Developer |
17% |
|
Computer & Information Research Scientist |
11% |
|
Biochemists and Biophysicist |
8% |
|
Physicists and Astronomer |
7% |
|
Chemists and Materials Scientist |
3% |
|
Computer Programmer |
−8% |
Note that “Data scientist” has not yet entered the list of job descriptions here, but that there is certainly some overlap with the categories “Software Developer” and “Computer and Information Research Scientist.” The increasing demand for statisticians raises a number of important questions:
Q1 Can we meet the demand?
Q2 How should we be gearing up to meet the increased demand?
Q3 What changes should we be making in the teaching of statistics to attract the best and brightest students?
Q4 What should we be teaching?
2.2. Challenges of big data. “Big data” continues to present a variety of challenges for statistics and data science: for computation and analysis, as well as for theory. On the other hand, in a lucid discussion, “big data” is dismissed by Donoho [13] as a distinction between statistics and data science. I will return to Donoho’s thought-provoking article briefly below.
2.3. Changes needed in statistical education? Meeting the increased demand for statisticians and data scientists and answering the challenges of big data, may well require further changes in degree structures and changes in curricula for existing and new degrees at all levels: high school, all college or university students, undergraduates, MS degree students, and PhD students. It may also require changes in the modes of teaching.
Johnstone’s short article [24] raises an intriguing question about student enrollment in undergraduate statistics majors, but that picture may well be changing with the increases in undergraduate study of statistics. Important developments and improvements are taking place at all these levels (see for example [16], [10], [6], [33], [5], [4]), but because of my own particular interests in graduate level teaching (and the current task from my chair), I will focus on curricula for MS and PhD programs in statistics during the remainder of this article.
There are clearly differing views within our community about the issues and challenges presented by data science for the statistics profession. Marie Davidian, said in the 2013 Report of the London Workshop on the Future of Statistical Sciences, [31]:
“I believe that the statistical sciences are at a crossroads, and that what we do currently … will have profound implications for the future state of our discipline. The advent of big data, data science, analytics, and the like requires that we as a discipline cannot sit idly by… but must be proactive in establishing both our role in and our response to the ‘data revolution’ and develop a unified set of principles that all academic units involved in research, training, and collaboration should be following. … At this point, these new concepts and names are here to stay, and it is counterproductive to spend precious energy on trying to change this. We should be expending our energy instead to promote statistics as a discipline and to clarify its critical role in any data-related activity.”
In an article [44] commenting on the London Workshop report, Terry Speed said:
“Are we doing such a bad job that we need to rename ourselves data scientists to capture the imagination of future students, collaborators, or clients? Are we so lacking in confidence … that we shiver in our shoes the moment a potential usurper appears on the scene? Or, has there really been a fundamental shift around us, so that our old clumsy ways of adapting and evolving are no longer adequate? … I think we have a great tradition and a great future, both far longer than the concentration span of funding agencies, university faculties, and foundations. … We might miss out on the millions being lavished on data science right now, but that’s no reason for us to stop trying to do the best we can at what we do best, something that is far wider and deeper than data science. As with mathematics more generally, we are in this business for the long term. Let’s not lose our nerve.”
On the other hand, Richard De Veaux, speaking at the London Workshop [31], said: “Statistics education remains mired in the twentieth (some would say the nineteenth) century.”
3. Back-tracking: History, part 1
At this point it might be helpful to review some of the history concerning the creation of departments of statistics in the US, and the organization of teaching in those departments. Harold Hotelling played a key role in this.
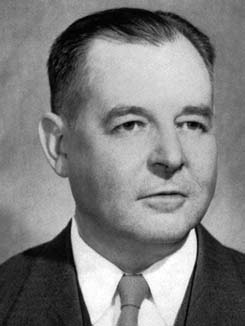
Harold Hotelling
Here is a brief recap of Hotelling’s career: He was born in 1895 in Minnesota. In 1904 he moved to Washington with his family. He studied journalism as an undergraduate at the University of Washington and earned a BA degree in journalism in 1919 after service in the Army during World War I interrupted his studies. Not finding journalism to his liking, Hotelling then earned an MS degree in Mathematics from the UW. During this period he was advised by Eric Temple Bell, who urged him to study economics. Hotelling gained entrance to the PhD program in Mathematics at Princeton, hoping to study mathematical economics and statistics. Finding no-one at Princeton engaged in these research directions, he turned to topology and differential geometry, earning a PhD degree under Oscar Veblen in 1924. Hotelling then joined the Food Research Institute at Stanford University and became associated with its Mathematics Department, where he served as an Assistant Professor during the period 1927–31. During this period he worked on both economics and statistics, and spent 6 months with R. A. Fisher at Rothamsted in 1929. In 1931 Hotelling moved to the Department of Economics at Columbia University, where he began attracting graduate students and other faculty interested in statistics, and he became involved in the early period of the IMS, serving as the sixth President of the IMS in 1941. During World War II Hotelling was deeply involved in the Statistical Research Group at Columbia, which played a key role in providing statistical advice to the US government and military. After failing to convince Columbia University to form a separate Department of Statistics, in 1946 Hotelling moved to the University of North Carolina at Chapel Hill, where he was able to create such a department. He remained at UNC Chapel Hill until his death in 1973. For further information concerning Hotelling and his work, see [41], [11], [2] and [47].
But the work of Hotelling which concerns us here is his 1940 paper [18] on the “Teaching of Statistics”. This was presented as an invited talk at a meeting of the IMS held in Hannover, New Hampshire. This could be viewed as a preliminary position paper of a committee formed by the IMS to examine the teaching of statistics. In his paper and talk Hotelling laid out the two difficulties involved in the teaching of statistics as of 1940, i.e., failure to recognize statistics as a science requiring specialists to teach it, and a shortage of qualified instructors.
Hotelling’s talk and paper strongly influenced Jerzy Neyman. Ingram Olkin [35] noted that Hotelling’s 1940 paper on the teaching of statistics “had a phenomenal impact. Jerzy Neyman stated that it was one of the most influential papers in statistics. Faculty attempting to convince university administrators to form a Department of Statistics often used this paper as an argument why the teaching of statistics should be done by statisticians and not by faculty in substantive fields that use statistics.”
On the other hand, the discussion of Hotelling’s paper by W.E. Deming raised issues relevant for applications: “Above all, a statistician must be a scientist. A scientist does not neglect any pertinent information.”
Hotelling authored at least two other works ([21], [19]) on the teaching of statistics. The 1948 Annals article was a report of the IMS Committee on the Teaching of Statistics with Hotelling as the chair and Walter Bartky, W. E. Deming, M. Friedman, and P. Hoel as further committee members. Part I of the article was presented as the consensus of the committee, was relatively brief and addressed the following questions:
(1) Who are the prospective students of statistics?
(a) All college (university) students.
(b) Future consumers of statistics.
(c) Future users of statistical methods.
(d) Future producers and teachers of statistical methods.
(2) What should they be taught?
(3) Who should teach statistics?
(4) How should the teaching of statistics be organized?
(5) What should be done about adult education?
The longer Part II of the article, The Place of Statistics in the University, was written by Hotelling and reflected his views. His major points are summarized:
A. Minor nuisances and inefficiencies in statistical teaching (Lack of coordination among departments; Lack of advanced courses and laboratory facilities; Inefficient decentralization of libraries)
B. The major evil: failure to recognize the statistical method as a science, requiring specialists to teach it (Too many teachers not specialists; Results: students ill equipped; Reasons why teachers of statistics are often not specialists: the rapid growth of the subject, confusion between the statistical method and applied statistics, failure to recognize the need for continuing research, and the system of making appointments to teach statistics within particular departments that are devoted primarily to other subjects; Appointments under the existing system are not all bad; Unsatisfactory texts; Omission of probability theory from texts and teaching)
C. Proper qualifications of teachers of statistics (Statistics compared with other subjects; Current research in the statistical method is essential for teachers; Minimum requirements in mathematics for the training of teachers and research men [sic] in statistical theory)
D. Need for relating theory with applied statistics (An example of the interaction between theory and practice; Supplying opportunities for application in graduate studies of statistics)
E. Recommendations on the organization of statistical teaching and research in institutions of higher learning (Research should be encouraged; teaching schedules should not be overloaded; Organization of statistical service in the university; Organization for teaching; The statistical curriculum; Statistical method as part of a liberal education).
The 1940 paper [18] and the 1948 committee report [21] were reprinted in Statistical Science in 1988 [20], followed by discussion pieces by D.S. Moore, J.V. Zidek, K.J. Arrow, H. Hotelling Jr., Ralph Bradley, W.E. Deming, S.S. Gupta, and I. Olkin. The discussion pieces reflected the long-standing (and creative) tensions between the influence of mathematics on statistical theory on the one side, and applications/data analysis on the other. Here, I will simply note Shanti S. Gupta’s view of Hotelling’s papers: “He rightly visualized the academic statistician as a tool-maker who ‘must not put all his time on using the tools he makes’, but must focus his/her attention on the tools themselves.”
Hotelling [18] had expressed the balancing act as follows: “Statistical theory is a big enough thing in itself to absorb the full-time attention of a specialist teaching it, without his going out into applications too freely. Some attention to applications is indeed valuable, and perhaps even indispensable as a stage in the training of a teacher of statistics and as a continuing interest. But particular applications should not dominate the teaching of the fundamental science, any more than particular diseases should dominate the teaching of anatomy and bacteriology to pre-medical students.”
In a review of the 1948 Hotelling Committee report and a similar report on the teaching of statistics by a committee of the Royal Statistical Society [25], Truman L. Kelley (Professor of Education at Harvard University) wrote: “It seems to the reviewer that there is implicit in the British recommendation an induction of the student into statistics via the subject matter of his field of specialization, and in the American an induction via logic, including principles of mathematics and probability. It is needless to say that these approaches are far asunder.”
These two quotes are a small sample of the long-running tensions within statistics and statistics education. In my view, these tensions are an inherent part of the process of creating new statistical methods and perspectives. Kelley [25] continued:
“The American committee, by omission and by inclusion, reveals what it considers to be preparatory background for students of statistics. It at no point cites knowledge of data in some scientific field as essential. … The American committee deplores the general lack of mathematical competence of most teachers of statistics in different subject matter fields. This is deplorable as is their lack of knowledge of the genius of data in their fields. However, the progress of recent decades should make one optimistic, and these two committee reports should encourage college presidents to strengthen and broaden the instruction in both mathematical and applied statistics.”
4. Back-tracking: History, part 2
A second set of important developments:
• In his 1962 paper, “The future of data analysis” [46], John Tukey called for a revamping of academic statistics, and pointed to a new science focused on data analysis.
• John Chambers (1993, [7]) and Bill Cleveland (2001, [9]) developed Tukey’s ideas further.
• Leo Breiman’s (2001) “Two cultures…” paper [3] clearly delineated the differing approaches to data analysis which developed in the years since Tukey (1962): Predictive modeling; Common Task Framework, and Generative modeling; Inference
• Donoho (2015), “50 years of Data Science” [13], gives a guide to this history, explains the key role of the Common Task Framework, and provides an updated road map to what he calls Greater Data Science.
Now we fast-forward to 2002–2004. By the beginning of the 21st century the era of data science, “big data”, and machine learning was well underway. Breiman’s (2001) paper [3] clearly delineated the differences in approaches to data analysis which had developed in the years since Tukey (1962) [46]. In May 2002, the NSF hosted a workshop on future challenges and opportunities for the statistics community. The resulting “Report on the Future of Statistics” by Bruce Lindsay, Jon Kettenring and David O. Siegmund (2004, [30]):
• addressed features of the statistical enterprise relevant to the NSF;
• did not include biostatistics;
• did not explicitly address teaching of statistics, but alluded to teaching indirectly through “manpower” problems;
• identified opportunities and needs for the “core of statistics”.
As noted in the report:
“If there is exponential growth in data collected and in the need for data analysis, why is “core research” relevant? … Because unifying ideas can tame this growth, and the core area of statistics is the one place where these ideas can happen and be communicated throughout science.”
Of course, there have been big changes both in statistics and in the world of science in general since Hotelling’s time, and even since the Lindsay-Kettenring-Siegmund report of 2004. Here is an oversimplified summary, making comparisons between 1940 and now (or 2015):
|
“Then” (1940) |
“Now” (2015) |
|
|
# of statistics departments |
5–10 |
≈60 |
|
# of biostatistics departments |
≈1 |
≈43 |
|
# of graduate students, statistics |
< 50? |
4597 (24%) |
|
# of graduate students, biostatistics |
< 10? |
1960 (14%) |
|
IMS membership |
< 100? |
≈3500 |
|
Computer clock speed |
5–10Hz Zuse Z3 (1941) |
>2.7GHz Mac Powerbook |
|
Terminology/ Department names |
Mathematical Statistics, |
Statistics, Data Analysis, |
This table shows that one clear outcome of Hotelling’s papers [18], [21] and [19] has been the establishment of separate departments of statistics in the US. Now we are in the midst of considerable (remarkable? large? exponential?) increases in enrollment in the courses offered by these departments. The following two graphs (by Steve Pierson [38]) show the growth in Bachelor’s, Master’s, and PhDs in Statistics and Biostatistics combined and in Biostatistics (separately) over the period 1987–2015 [in the US]:
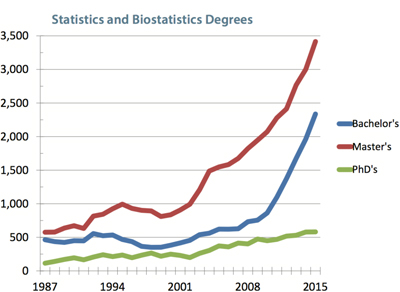
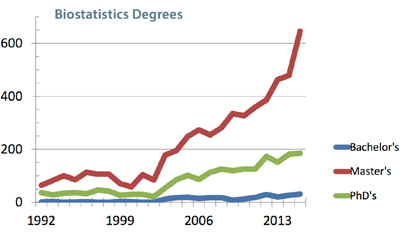
Note the much slower growth in PhD degrees versus degrees at the Masters and Bachelors levels. Comparing these curves gives some pause for reflection!
5. MS curricula in statistics
But what about the curricula of the new Data Science and Machine Learning programs? For example, what is the curriculum of one of the typical new Data Science (DS) MS degree programs?
Donoho (2015) section 7 reviews a typical such curriculum (at UC Berkeley). There the core of the MS Data Science curriculum includes: Research Design and Application for Data and Analysis; Exploring and Analyzing Data; Storing and Retrieving Data; Applied Machine Learning; and Data Visualization and Communication. The advanced courses include: Experiments and Causal Inference; Applied Regression and Time Series Analysis; Legal, Policy, and Ethical Considerations for Data Scientists; Machine Learning at Scale; Scaling up! Really big data; and a Capstone course (with data analysis project). The program at Berkeley is run by the Information School.
At my home, the University of Washington, the DS MS program is run by the E-Science Institute (with co-operation) from Statistics, CS, and Biostatistics. The curriculum includes: Introduction to Statistics and Probability; Data Visualization & Exploratory Analytics; Applied Statistics and Experimental Design; Data Management for Data Science; Statistical Machine Learning for Data Scientists; Software Design for Data Science; Scalable Data Systems and Algorithms; Human-Centered Data Science; and Data Science Capstone Project
There is clear overlap in both lists with courses offered in a traditional statistics MS program, but with a number of substitutions from a Computer Science MS program. Ten American MS Programs in Data Science and Analytics were surveyed in Amstat News articles in April and June 2017. Each of these surveys included the following query to one of the principal organizers or instructors for the program: “Do you have any advice for institutions considering the establishment of such a degree?”
One of the responses, which seemed very thoughtful and relevant, was from Mark Craven, Univ of Wisconsin–Madison: “I would advise any institution considering this area to build on existing partnerships between statistics, biostatistics, computer sciences, and biomedical informatics. No one unit can or should ‘own’ this area, so proceeding in a broad and inclusive way makes the most sense.”
Donoho [13] gives an analysis of the Berkeley Data Science curriculum in the context of Tukey’s critiques and writings. He writes: “Although my heroes, Tukey, Chambers, Cleveland and Breiman, would recognize positive features in these programs, it’s difficult to say whether they would approve of their long-term direction —or if there is even a long-term direction to comment about: … Data Science Masters curricula are compromises: taking some material out of a Statistics masters program to make room for large database training; or, equally, taking some material out of a database masters in CS and inserting some statistics and machine learning. Such a compromise helps administrators to quickly get a degree program going, without providing any guidance about the long-term direction of the program and about the research which its faculty will pursue. What long-term guidance could my heroes have provided?’’
6. PhD curricula in statistics
At the University of Washington, the PhD program has four possible tracks: Normal/ Basic track; Statistical genetics; Statistics for the Social Sciences; and Machine Learning (ML) and Big Data (BD). The following table shows PhD student numbers in each of these tracks at the University of Washington over the period 2001-2016:
|
track |
Graduated |
Current |
Total |
|
Normal, Stat |
83 |
37 |
120 |
|
Normal, Biost |
103 |
49 |
152 |
|
StatGen, Stat |
13 |
3 |
16 |
|
StatGen, Biost |
5 |
3 |
8 |
|
Stat in Soc Sci |
5 |
1 |
6 |
|
ML-BD |
1 |
13 |
14 |
|
total, Stat |
102 |
54 |
156 |
|
total, Biostat |
108 |
52 |
160 |
From this table (and especially the 13 PhD students currently enrolled in the ML-BD track) it is clear that the ML-BD track is proving to attract a substantial number of our current PhD students. This makes re-consideration of the curriculum in statistical theory (and methodology) increasingly important. What should I be teaching in Statistics 581-582 during the coming two quarters? What would my heroes recommend if they were here to offer their wise advice?
My heroes are different than David Donoho’s; they include: H. Chernoff, J.L. Doob, R.A. Fisher, Jaroslav Hajek, Wassily Hoeffding, Harold Hotelling, Jack Kiefer, Lucien Le Cam, Charles Stein and Abraham Wald. My sense is that future research directions, including manifold learning, topological data analysis, and statistical methods to deal with nonstandard data types (functions, trees, images, etc.) will require more mathematics and more probability rather than less.
7. Back to my problem: what to teach in the theory course sequence?
Here is a brief outline of UW’s current Statistics 581, 582 and 583 courses.
Outline for Stat 581:
• Inequalities; basic asymptotic theory in statistics. Examples: robustness (or lack of robustness) of normal theory tests; chi-square statistic and power of chi-square tests under fixed and local alternatives; limit theory for fixed dimension linear regression; limit theory for correlation coefficients; limit theory for empirical distributions and sample quantiles; examples from survival analysis/censored data.
• Lower bounds for estimation. Multi-parameter Cramér–Rao lower bounds; super-efficiency & introduction to Hajek–Le Cam convolution theorem and local asymptotic minimax theorems; simple lower bound lemma via two point inequalities.
• Classical (and nonparametric) maximum likelihood: Existence; empirical d.f. & empirical measure as MLEs; algorithms, one step approximations, and EM; LR, Wald, and Rao tests: fixed and local alternatives; Brief introduction to agnostic viewpoint: what if the model fails?
Outline for Stat 582:
• Elementary Decision Theory: Bayes rules, minimax rules, and connections.
• Bayes theory, inadmissibility, and empirical Bayes.
• Optimal tests and tests optimal in subclasses: eliminating nuisance parameters by conditioning and invariance.
Outline for Stat 583:
• Parameters as functionals and the Delta Method. Continuity: probability metrics and properties of functionals; differentiability of functionals: Fréchet, Hadamard, and Gateaux; examples and applications.
• Resampling methods. General approach to bootstrap and resampling methods; Jack-knife; Bootstrap methods; examples and applications; Bootstrap and the delta method.
New in Statistics 581 – 582 during this coming year?
• Large scale hypothesis testing and FDR’s?
• More on empirical Bayes?
• More on convexity?
• More on empirical process theory and use of inequalities?
• …??
What should be reduced or deleted? I don’t know exactly yet, but I’m working on it… and on the report to my chair.
Let me close with a couple of excerpts from Efron and Hastie [14]. From the Preface, page xvii: “Useful disciplines that serve a wide variety of demanding clients run the risk of losing their center. Statistics has managed, for the most part, to maintain its philosophical cohesion despite a rising curve of outside demand. The center of the field has … moved in the past sixty years, from its traditional home in mathematics and logic toward a more computational focus.” And from the Epilogue, page 447: “It is the job of statistical inference (theory) to connect ‘dangling algorithms’ to the central core of well-understood methodology. The connection process is already underway.”
Here, then, is a brief summary of my views:
• Embrace and encourage data science!
• Continue evolving the curriculum to teach the unifying themes of statistical research.
• Keep doing what statisticians do best: question, question, question… and then provide the best answers possible, based on the available data.
• Attract the best and brightest students to research work in statistics.
• Teach what we know!
I’d like to close with a personal aside: H. Hotelling played a significant role in my own involvement in statistics as a career. As is clear from the Statistical Science “Conversation with Z.W. Birnbaum” [32], Hotelling pointed (Bill) Birnbaum toward a position at the University of Washington in 1939. Bill created a strong environment for statistics within the UW Math Department during the period 1940–1970, and his students Ronald Pyke, Albert Marshall, and the people they attracted to the UW became my teachers and mentors when I arrived at the UW in 1971.
References
[1] A. Agresti and X.-L. Meng, editors. Strength in Numbers: the Rising of Academic Statistics Departments in the US. Springer, New York, 2013.
[2] K.J. Arrow and E.L. Lehmann. Harold Hotelling, September 29, 1895–December 26, 1973. Biographical Memoirs, National Academy of Sciences, 87:220–233, 2006. http://www.nap.edu/catalog11522.html.
[3] L. Breiman. Statistical modeling: the two cultures. Statist. Sci., 16(3):199–231, 2001. With comments and a rejoinder by the author.
[4] E.N. Brown and R.E. Kass. Rejoinder [mr2750071; mr2759682; mr2759683; mr2759684; mr2759685; mr2759686]. Amer. Statist., 63(2):122–123, 2009.
[5] E.N. Brown and R.E. Kass. What is statistics? Amer. Statist., 63(2):105–111, 2009.
[6] N. Chamandy, O. Muralidharan, S. Wager. Teaching statistics at Google-scale. Amer. Statist, 69(4):283–291, 2015
[7] J.M. Chambers. Greater or lesser statistics: a choice for future research. Statistics and Computing, 3:182–184.
[8] R. Chellappa. Mathematical statistics and computer vision. Image and Vision Computing, 30:467–468, 2012.
[9] W.S. Cleveland. Data science: an action plan for expanding the technical areas of the field of statistics. International Statistical Review, 69:21–26, 2001.
[10] G.W. Cobb. Teaching statistics: some important tensions. Chil. J. Stat., 2(1):31–62, 2011.
[11] A. C. Darnell. Harold Hotelling 1895-1973. Statistical Science, 3:57–62, 1978.
[12] R. A. Davis. IMS Presidential Address: Are we meeting the challenge? IMS Bulletin, 45(7), Oct/Nov 2016.
[13] D. Donoho. 50 years of data science. Technical report, Dept of Statistics, Stanford University, 2015. presented at the Tukey Centennial Workshop, Princeton U.; http://courses.csail.mit.edu/18.337/2015/docs/50YearsDataScience.pdf.
[14] B. Efron and T. Hastie. Computer Age Statistical Inference, volume 5 of IMS Monographs. Cambridge University Press, New York, 2016.
[15] P. Hall. We live in exciting times. In Past, Present, and Future of Statistical Science, pages 157–169. Chapman and Hall, Boca Raton, FL, 2015.
[16] N. J. Horton and J. S. Hardin. Teaching the next generation of statistics students to “think with data”: special issue on statistics and the undergraduate curriculum [Guest editorial]. Amer. Statist., 69(4):259–265, 2015.
[17] H. Hotelling. The selection of variates for use in prediction with some comments on the general problem of nuisance parameters. Ann. Math. Statist., 11:271–283, 1940.
[18] H. Hotelling. The teaching of statistics. Ann. Math. Statist., 11:457–470, 1940.
[19] H. Hotelling. The place of statistics in the university. In Proc. First Berkeley Sympos. Math. Statist. & Probability (Berkeley, Calif., 1949), Vol. I: Statistics, pages 21–40. Univ. of California Press, Berkeley, Calif., 1949.
[20] H. Hotelling. Golden oldies: Classic articles from the world of statistics and probability: The teaching of statistics. Statist. Sci., 3:63–71, 1988.
[21] H. Hotelling, W. Bartky, W. Deming, M. Friedman, and P. Hoel. The teaching of statistics. Ann. Math. Statist., 19:95–97, 1948.
[22] P. J. Huber. The behavior of maximum likelihood estimates under nonstandard conditions. In Proc. Fifth Berkeley Sympos. Math. Statist. and Probability (Berkeley, Calif., 1965/66), Vol. I: Statistics, pp 221–233. Univ. California Press, Berkeley, Calif., 1967.
[23] P. J. Huber. Data Analysis. John Wiley & Sons, Inc., Hoboken, NJ, 2011.
[24] I. Johnstone. Where are the majors? In Past, Present, and Future of Statistical Science, pp 153–156. Chapman and Hall, Boca Raton, FL, 2015.
[25] T. L. Kelley. Review of: “The Teaching of Statistics: A Report of the Institute of Mathematical Statistics” and “The Teaching of Statistics in Universities and Colleges. J. Amer. Statist. Assoc., 43:493– 496, 1948.
[26] M. R. Kosorok. Rejoinder to discussion of “What’s so special about semiparametric methods?” [mr2639296; mr2639297; mr2639298]. Sankhyā, 71(2, Ser. A):369–371, 2009.
[27] M. R. Kosorok. What’s so special about semiparametric methods? Sankhyā, 71(2, Ser. A):331–353, 2009.
[28] M. Liberman. Reproducible research and the common task method. Technical report, Simons Foundation Frontiers of Data Science Lecture, 2015. video available.
[29] X. Lin, C. Genest, D. L. Banks, G. Molenberghs, D. W. Scott, and J.-L. Wang, editors. Past, Present, and Future of Statistical Science. Chapman and Hall, Boca Raton, FL, 2015.
[30] B. G. Lindsay, J. Kettenring, and D. O. Siegmund. A report on the future of statistics. Statist. Sci., 19(3):387–413, 2004. With comments.
[31] D. Mackenzie, D. Madigan, and R. Wasserstein. Statistics and science; A Report of the London Workshop on the Future of the Statistical Sciences. 2013.
[32] A. W. Marshall. A conversation with Z. William Birnbaum. Statist. Sci., 5(2):227–241, 1990.
[33] XL Meng. Desired & feared: what do we do now and over the next 50 years? Amer. Statist, 63(3):202–210, 2009.
[34] J. Neyman. First Course in Probability and Statistics. Henry Holt and Co., New York, N. Y., 1950.
[35] I. Olkin. Reminiscences of the Columbia University Department of Mathematical Statistics in the late 1940s. In Past, Present, and Future of Statistical Science, pp 23–28. Chapman and Hall, Boca Raton, FL, 2015.
[36] I. Olkin and A. R. Sampson. Harold Hotelling. In C. C. Heyde, E. Seneta, P. Crepel, S. E. Fienberg, and J. Gani, editors, Statisticians of the Centuries, pp 454–458. Springer New York, New York, NY, 2001.
[37] I. Olkin and A. R. Sampson. Hotelling, Harold (1895–1973). In International Encyclopedia of the Social and Behavioral Sciences, pages 6921–6925. 2001.
[38] S. Pierson. Science policy: Statistics, biostatistics degree growth sustained through 2015. Amstat News, 472:16–19, 2016.
[39] S. Pierson. Master’s programs in data science and analytics. Amstat News, 478:22–27, 2017.
[40] S. Pierson. Master’s programs in data science and analytics (continued … ). Amstat News, 480:15–24, 2017.
[41] W. L. Smith. Harold Hotelling 1895 – 1973. Ann. Statist., 6(6):1172–1183 (1 plate), 1978.
[42] W. L. Smith. Harold Hotelling, 1895-1973. Ann. Statist., 6:1172 –1183, 1978.
[43] T. Speed. Hotelling, and the teaching of statistics, Hotelling lecture # 1. University of California, Berkeley, 2007.
[44] T. Speed. Trilobites and us. Amstat News, January 2014, 439(1):9–10, 2014.
[45] S. M. Stigler. The Seven Pillars of Statistical Wisdom. Harvard University Press, Cambridge, MA, 2016.
[46] J. W. Tukey. The future of data analysis. Ann. Math. Statist., 33:1–67, 1962.
[47] Wikipedia. Harold Hotelling. 2017. https://en.wikipedia.org/wiki/Harold_Hotelling.
[48] B. Yu. IMS Presidential address: Let us own data science. IMS Bulletin, 43(7), Oct/Nov 2014.
1 comment on “2017 Presidential Address: Teaching Statistics in the Age of Data Science”