Recently I attended a lecture about the use of statistical models to solve a problem in molecular biology. Some impressive results on sensitivity, specificity and accuracy were presented. But mostly I was struck by the fact that the Bayesian graphical models used in the analysis were entirely expressed in the plate notation (check Wikipedia): there wasn’t a single equation in the presentation. Whether a variable was normal, Poisson, gamma or Dirichlet wasn’t spelled out, though one could try and guess this from the variable name. Parameterizations had to be inferred as well. The role of subscripts was taken over by the nesting relationships in the plates. During the lecture I was unable to translate the diagram into something I fully understood, and I wondered whether anyone else in the audience could. I was reminded of the advice someone gave Stephen Hawking: that every equation he included in A Brief History of Time would halve the sales. Was my lecturer strictly following that advice? (Hawking did include one equation: e=mc2.) What about every plate diagram? Some slides had two, and one had three of them. In another lecture I attended very soon afterwards, this experience was repeated. I had to wonder whether it’s me, and not them. Can the modern user of Bayesian graphical models read plate diagrams as readily as I can read linear models in matrix form? Am I the only person who thinks that sometimes twenty words is worth more than a picture?
The need to represent statistical models is (necessarily) as old as the use of statistical models. Gauss in the early part, and Yule at the end of the 19th century, used equations without subscripts. Here is Yule’s 1899 linear model for pauperism: “change per cent. in pauperism = −27.07 per cent. + 0.299 (change per cent. in out-relief ratio), + 0.271 (change per cent. in proportion of old), + 0.064 (change per cent. in population),” and so on.
I don’t know the first use of subscripts in statistics, but they were certainly there in 1889 in the work of Thiele. He wrote a linear model for observation om,n made using the mth parallel thread of the passage time of star n travelling at known velocity hn, as λ1(om,n) = gn + fm/hn . Here λ1 is Thiele’s version of our modern expectation E. In their 1932 book on matrices, Turnbull and Aitken used an almost modern matrix notation for linear models, Ax−h = ε.
Multiple subscripts were still used in the early 1960s when I learned linear models. When I started teaching linear regression, I used y = Xβ + ε, and still do. At one point, I wanted to get away from the craziness of fixed, random and mixed, and wrote my linear models for the expectation and dispersion D of an array y as follows: E(y) ∈ L, D(y) ∈ V, where L is a linear subspace and V is a suitable class of covariance matrices. Much to my regret, this didn’t catch on.
Of course we always need words as well; we can save a few by writing the standard linear model as y|(X, β, σ2) ~ N(Xβ, σ2I). Bayesians can then preface this by their priors, e.g. β~N(λ, Ω) and σ2 ~ IG(φ,ψ). Most of the models that I meet can be concisely described by a small collection of expressions like these, and independence statements, and that is my preference. I accept that this approach does not highlight the conditional independences within the model, but I think that much of the time (as in linear models) this is a side issue. Plate diagrams may still be preferred by people who haven’t become familiar with the nesting and crossing of subscripts, though as someone who has dealt with many subscripts, I worry about multiply nested or crossed plates.
I’m not the first and won’t be the last person to find graphical models with plate diagrams a challenge to decode. There’s plenty of discussion of these issues in papers and in blogs. We want our model descriptions to communicate and explain our models. Other requirements, which seem less central to me, include their being helpful for devising new models, and for programming to analyse data using the models. Whatever we present, there will be some assumed knowledge: a way of denoting the nesting of subscripts, a convention for what is observed and what is not, and so on; in short, we need to know how to read them. Here, familiarity is paramount.
From some time in the late 19th century until the mid-1930s, words for linear models were replaced by variables with subscripts, which were replaced by matrices. Plate diagrams were invented by David Spiegelhalter around 1994, but have only become widely used in the last few years. Perhaps I am complaining too soon…
—
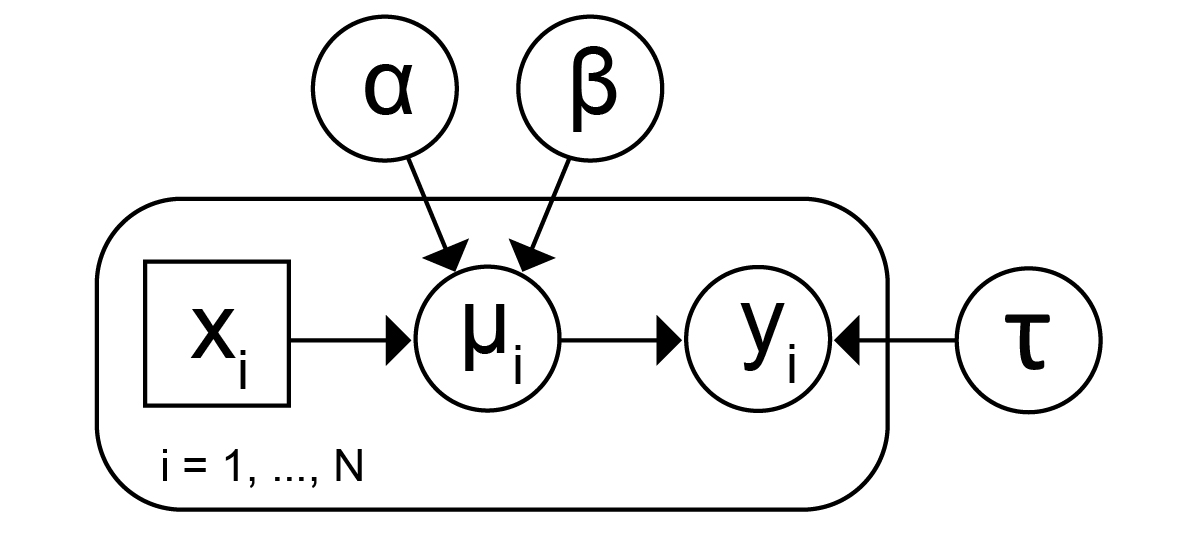
Plate notation for the simple linear regression model
Comments on “Terence’s Stuff: Representing statistical models”